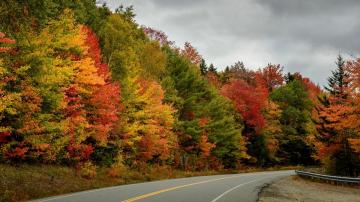

Photo: yggdrasill (Shutterstock)
Labor Day has come and gone, which means it’s now time to lean into fall, including cooler weather and changing leaves—and enjoy it while it lasts. To that end, SmokyMountains.com puts out an annual fall foliage map, which indicates when fall colors are likely to be at their best across the country, broken down to the county level and by week. The predictions begin on Sept. 4 and end just before Thanksgiving on Nov. 20.
Obviously, no prediction is 100% accurate. But if you’re planning to do any leaf-peeping—whether in another state or simply in your own backyard—you can use this map to maximize your chances of enjoying peak fall foliage.
How to use the 2023 fall foliage map
The foliage map is color-coded based on level of peak: no change, minimal, patchy, partial, near peak, peak, and past peak. To view predictions over time, simply move the slider from left to right.
Fall foliage is expected to be at partial or near peak across the northern U.S. (including New England) and down into the mountain west sometime in the third or fourth week of September, with peaks predicted in the first week of October (at which point partial peaks should arrive in the mid-Atlantic and Pacific coast regions). The Southeast is the last place to peak in mid-November.
According to the folks behind the foliage map, there are a number of data points used to predict peaks:
NOAA historical temperaturesNOAA historical precipitationNOAA forecast temperaturesNOAA forecast precipitationHistorical leaf peak trendsPeak observation trendsThe map also takes into account user reports—if you’re so inclined, you can add data by filling out a three-question form indicating your state, zip code, and foliage level, from “meh, no color yet” to “past peak.”